TimingProfiler
Predict and monitor timing behavior at early stages of software development
TimingProfiler helps you identify application parts that cause unsatisfactory execution times.

Dynamic Timing Measurement
TimingProfiler measures actual execution times on real hardware, providing valuable insights that complement static timing analysis. Get empirical data about your system's timing behavior. Real Execution Measure timing on actual target hardware
Real Execution
Measure timing on actual target hardware
Statistical Analysis
Comprehensive statistical evaluation of timing data
Validation
Validate static analysis results with measurements
TimingProfiler helps you identify application parts that cause unsatisfactory execution times. It delivers results as soon as there is compiled code, and thus can be used very early in the development process, when measurements on physical hardware are costly or plain impossible.
This makes TimingProfiler ideally suited for constantly monitoring timing behavior during software development and in model-based development environments.

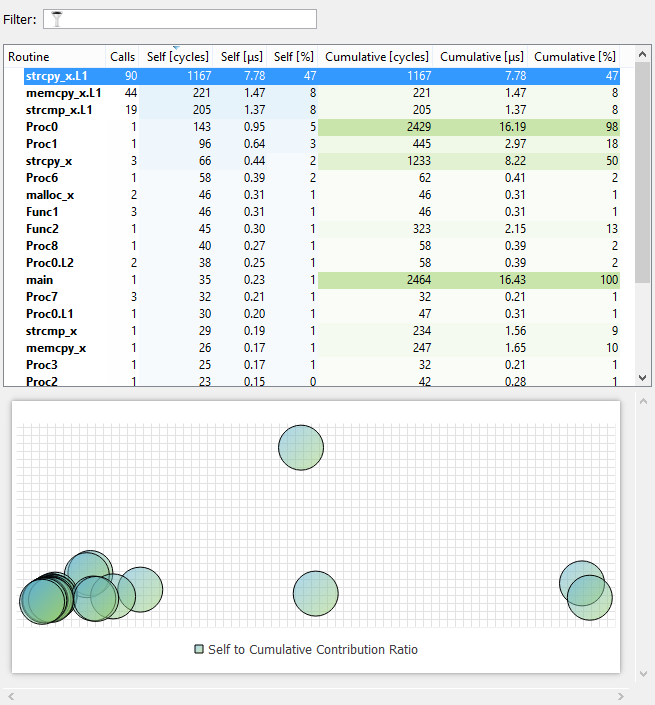
Function stats

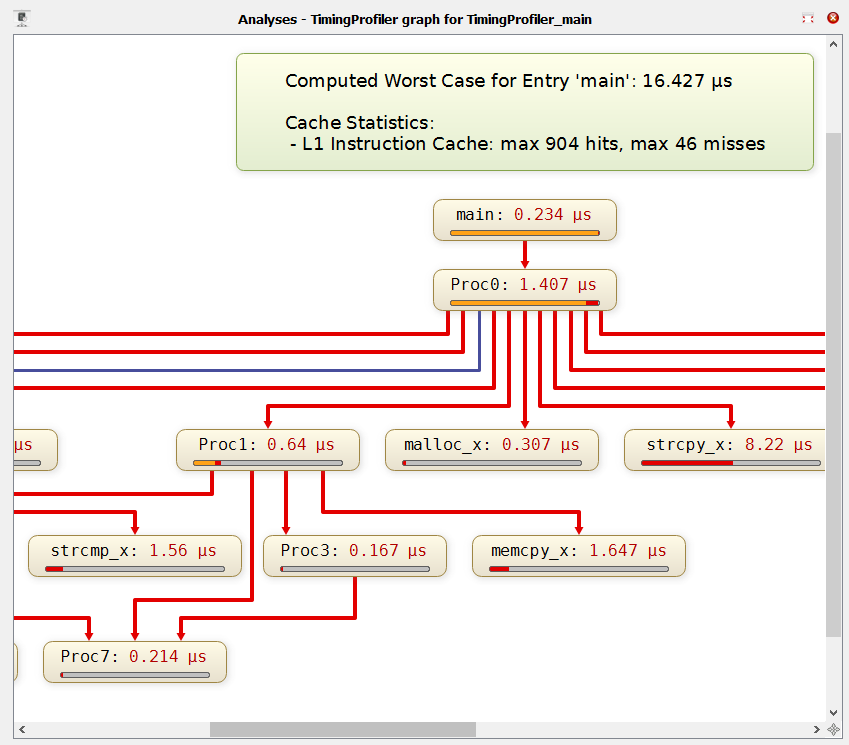
Call graph with timing information

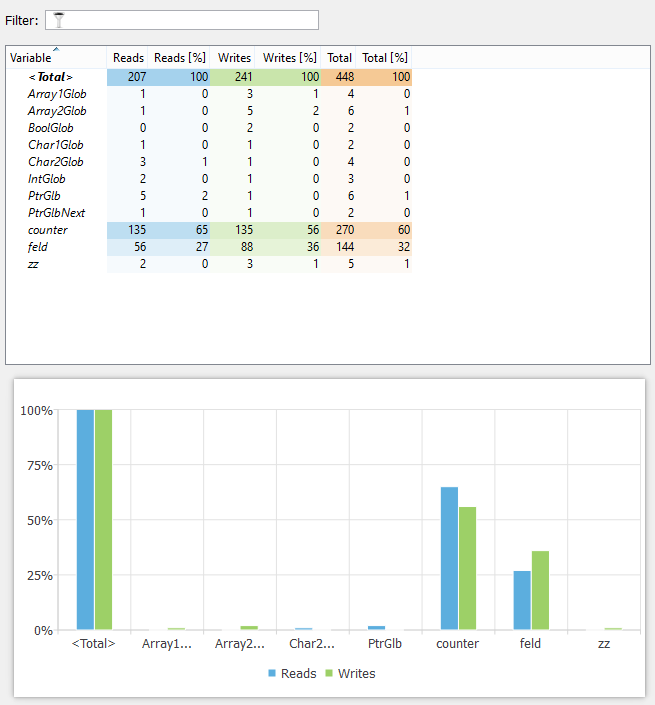
Usage of variables
The Dilemma
- Tests on physical hardware are typically based on code instrumentation, require elaborate technical equipment and cause significant effort. Worse still, they only provide feedback about the average-case behavior.
- For obtaining worst-case guarantees, static analysis tools such as aiT WCET Analyzers are available that do not require access to the physical hardware and can be easily automated. However, they are typically used late in the development and have to take into account the software and hardware configuration in great detail.
The Solution
TimingProfiler has been specifically developed to apply static-analysis techniques at early development stages, providing quick feedback about the timing behavior. It takes executable code as input and explores the timing of all potential execution paths of each task on a generic processor with the target instruction set, e.g. PowerPC.
The goal is not to give precise worst-case guarantees, but to enable development of applications in a timing-conscious way without cumbersome measurements on physical hardware. In fact, the analysis is applicable when no hardware is available yet, or the application is not mature enough for measurements.
No user interaction is required. Information not statically available is filled in by specialized heuristics, developed and fine-tuned in close co-operation with long-standing customers from various industries working on real-world software. Hence, the resulting execution time is a realistic worst-case scenario, albeit not a guarantee as provided by aiT.
Your Benefits
- TimingProfiler gives detailed information about the execution time and time-critical paths.
- The analysis is purely static. It requires no access to physical hardware and no code instrumentation.
- The analyzer does not need to be stimulated with concrete inputs. By default, it takes all potential inputs into account.
- Nevertheless, the analysis can be restricted to specific execution scenarios if desired.
- The tool shows call and control flow graphs, and displays all relevant information about the executable.
- Hotspots and bottlenecks can be identified at early development stages so that late-stage integration problems can be avoided.
- This provides for easy integration into the development process, and enables application in continuous test and integration frameworks.
- TimingProfiler can be seamlessly coupled with StackAnalyzer to additionally take the stack behavior into account, providing a unified approach to addressing resource usage.
Key Features
- Runtime timing measurement
- Statistical analysis
- Complement to static analysis
- Real hardware execution
- Detailed timing reports
- Variety of target architectures supported
- Integration with SCADE suite from Ansys
Measurement Process
Application Areas
Development
Performance optimization during development
Aerospace Systems
Timing validation in test environments
Industrial Control
Evidence generation for safety certification
Industrial Control
Timing-related bug investigation
Measure Your System's Timing
Get empirical timing data to complement your static analysis
